The Ottawa Airport Authority (the Authority) is committed to improving environmental performance and reducing the impact its operation has on the environment. The Environmental Performance Report tracks progress through the following key performance indicators, while the annual Environmental, Social, and Governance (ESG) Report outlines progress on specific material goals that promote sustainable and ethical practices across the organization and community.
STORMWATER QUALITY
For safety reasons, aircraft require de-icing during the winter months. The Authority monitors all stormwater property outlets for glycol and other parameters resulting from de-icing activities. Early in the 2022-2023 season (end of April), glycol readings exceeded the acceptable limit at one property outlet during the spring melt. This exceedance was reported to the Ontario Spill Action Centre. A study will be undertaken in the 2023 / 2024 de-icing season to isolate the source of glycol in the spring runoff.
2024 Goals
- Continue to monitor the outlets to identify and mitigate issues.
- Expand the understanding of glycol flows with an extended sampling plan.
- Emphasize repairs and maintenance of the sampling stations as more components reach end-of-life.
Type I and Type IV Glycol application (in litres)
2022-2023 de-icing season: 3,164,868**
2021-2022 de-icing season: 1,626,458*
2020-2021 de-icing season: 516,170*
2019-2020 de-icing season: 3,019,859
2018-2019 de-icing season: 3,535,468
2017-2018 de-icing season: 3,551,589
*A significant decrease in air traffic due to the pandemic significantly reduced the amount of glycol used at YOW.
** Return to pre-pandemic traffic.
Spill response
Accidental spills typically occur due to human error or equipment malfunction, mainly during aircraft servicing. The Authority and operators work to minimize the impact when spills occur. Most spills occur on hard surfaces, and the responsible parties clean them immediately before any environmental impacts are incurred. In 2023, 93 spills were reported. One spill entered a storm drain and was isolated to a catch basin. The drain was subsequently cleaned. This spill was reported to the authorities by the tenant. All other spills were contained and prevented from entering the environment.
2024 Goals
- Continue to promote employee awareness.
- Continue to promote regular equipment maintenance to reduce the number of spills.
- Continue to update the spill kit map and procedure to mitigate small and big spills.
Significant spills
(reported to Environment and Climate Change Canada and the Ontario Ministry of the Environment, Conservation and Parks):
2023: 1
2022: 0
2021: 0
2020: 0
2019: 0
2018: 0
2017: 0
2016: 1
AIRCRAFT NOISE
Although the Authority abides by Transport Canada-approved Noise Abatement Procedures, we are aware that some members of the public feel that aircraft noise is a nuisance. As residential development occurs near the Airport, the Authority continues to work with the City of Ottawa to discourage non-airport compatible land uses to minimize disturbance for future residents.
Summer airside infrastructure projects can disrupt commercial aircraft traffic patterns and can impact the community. To raise awareness and mitigate impacts, the Authority executes comprehensive communications plans in Ottawa-Gatineau, including media outreach and communication with stakeholders, the municipal and federal governments, and impacted communities as well as notifications on our website.
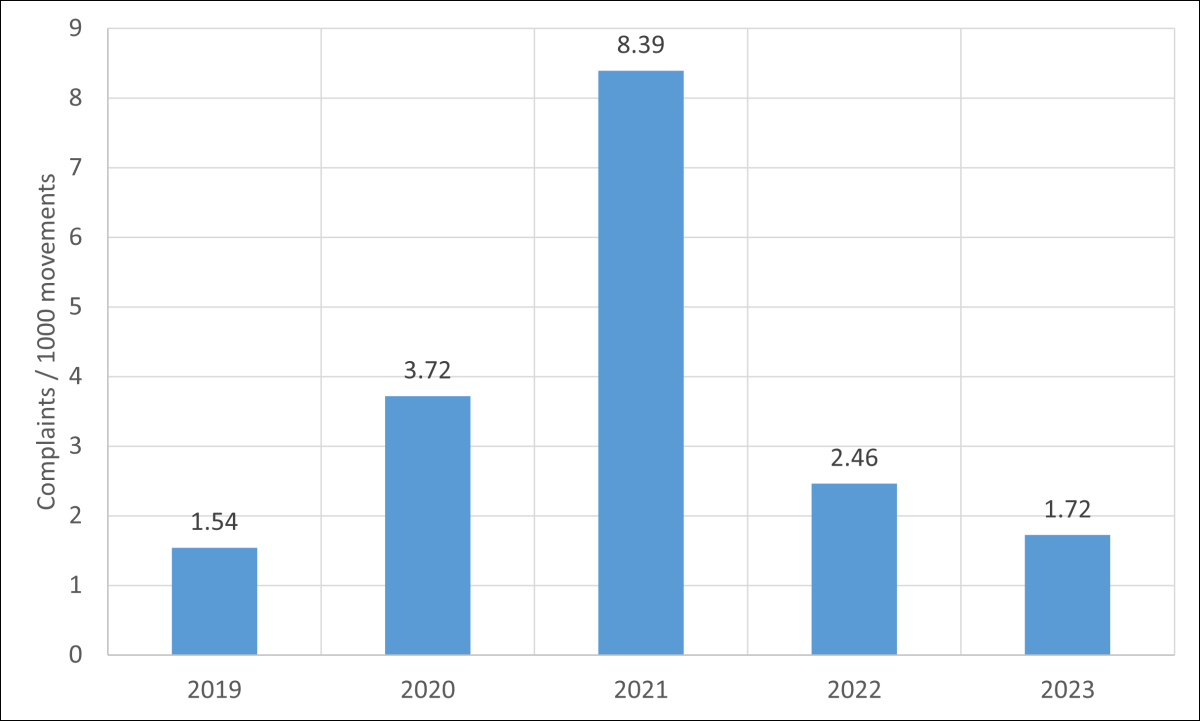
In 2023, we received 86 noise complaints compared to 97 in 2022, 146 in 2021, 87 in 2020 and 177 in 2019. The volume of noise complaints per flight is trending downwards. The following provides a breakdown:
- 9 circuit-related complaints
- 3 from frequent-callers
- 70 complaints related to commercial activities
- 8 from the same resident regarding increased overflight above Barrhaven
- 4 from the same resident in Britannia
- 3 from the same resident in Hull
- 6 complaints related to helicopters, air ambulances
- 1 complaint led to communications with NAV CANADA and an airline for clarifications of the Noise Abatement Procedure
The Authority logs all aircraft noise complaints and investigates them to ensure compliance with noise abatement procedures and the Canadian Aviation Regulations. Flight information concerning possible procedural deviations is provided to Transport Canada for investigation and enforcement purposes.
2024 Goals
- Continue to monitor and respond to noise complaints, discuss findings with residents, and identify recurring issues and solutions, where possible.
- Work with NAV CANADA and the aviation community to ensure compliance with proper procedures to minimize impacts to populated areas.
- Simplify the process for publishing a noise complaint to the Airport Authority and make it more accessible to citizens.
HAZARDOUS WASTE
In 2023, the Authority continued to recycle hazardous waste.
| Item | 2021 | 2022 | 2023 |
|---|---|---|---|
| Fluorescent lamp tubes | 225 m | 1,663 m | 1,668 m |
| Compact fluorescent lamps | 466 units | 143 units | 500 units |
| Metal halide bulbs | 470 units | 268 units | 135 units |
| Batteries | 395 kg | 148 kg | 425 kg |
| Aerosols | 20 kg | 100 kg | 38 kg |
| Paint | 40 L | 1,216 kg | 20 L |
| Waste oil | 4,380 L | 4,380 L | 6,883 L |
| Naphtha (parts cleaner) | 320 L | 80 L | 256 L |
2024 Goals
- Continue to minimize and recycle hazardous waste.
- Continue to replace hazardous products with more environmental alternatives such as replacing Metal Halide bulbs with LED light bulbs.
AIRPORT CARBON ACCREDITATION
YOW joined Airports Council International’s Airport Carbon Accreditation program in 2016 and achieved Level 1—Mapping. Since then, the Authority has implemented a Greenhouse Gas (GHG) Management Plan, engaged its stakeholders in the process, and purchased carbon offsets from Canadian Forests to reach Airport Carbon Accreditation Level 3+—Neutrality from 2019 to 2022. The Authority has also embarked on Environment and Climate Change Canada’s Net-Zero Challenge.
Four airside charge stations for ground support equipment (GSE) were installed. Making charge stations available allows our carriers and their support crews to replace their ground support vehicles with electric ones.
2024 Goals
- Continue to map all airport-related carbon emissions as per the Level 3+ accreditation process.
- Continue to offset the airport’s emissions with local carbon offsets.
- Where feasible, reduce GHG emissions as per the Net-Zero Comprehensive Plan.
- Certify YOW for 2022 emissions under ACA Level 3+ or better.
Direct GHG emissions in tonnes of CO2e /1000 passengers
2023: 5,361 tCO2e = 1.31
2022: 4,371 tCO2e = 1.45
2021: 3,853* tCO2e = 3.29
2020: 4,002* tCO2e = 2.93
2019: 5,232 tCO2e = 0.996
2018: 4,777 tCO2e = 0.934
2017: 4,987 tCO2e = 1.022
2016: 5,354 tCO2e = 1.129
*COVID-19 pandemic: While the pandemic significantly reduced passenger activity, minimum operational requirements for the Airport did not change materially. As such, the emissions per 1000 passengers increased significantly. Figures should stabilize over the next years as recovery continues.
Vehicle efficiency
The Authority’s operational vehicle fleet includes various equipment types, from small hand-held equipment and light-duty fleet vehicles, all the way to large industrial 1000 HP snow blowers. Fuel consumption varies considerably depending on the vehicle and its intended use, and the duration and severity of winter weather events. To aid in lowering fuel consumption and emissions, the Authority has a strict “no idling” policy that dictates that vehicles not in use are to be turned off and plugged in where applicable. The Authority also aims to replace all internal combustion engines (ICEs) with electric or low-emitting fuel alternatives, as part of its Net-Zero plan.
In 2023, the Authority purchased four all-electric vehicles and two plug-in hybrid vehicles.
Fuel use (in litres)
2023: 458,807
2022: 442,069
2021: 353,090
2020: 452,969
2019: 666,140
2018: 721,472
2017: 641,254
2016: 698,257
2024 Goals
- Reduce consumption by continuing to monitor for new technology that improves efficiency.
- Maintain a proactive maintenance schedule, enhancing the fleet’s overall efficiency.
- Replace each end-of-life vehicle or equipment with a low-emitting alternative.
BUILDING EFFICIENCY
Electricity
In an effort to move away from fossil fuels, electricity use is expected to increase significantly in the future due to the electrification of heating systems and the adoption of electric vehicles.
Electricity use (in 100,000 kW/h)
2023: 23.6
2022: 22.2
2021: 19.7
2020: 20.4
2019: 26.2
2018: 25.1
2017: 27.7
2016: 27.8
2023 Goals
- Continue to retrofit lighting to LED.
- Optimize the Building Automation System (BAS) to define more efficient equipment schedules.
Water
Water use varies yearly based on factors such as passenger volume and weather. In 2023, water use for the airport was 66,267 m3.
Water consumption (in m3)
2023: 66,267
2022: 63,156
2021: 29,366
2020: 36,255
2019: 75,627
2018: 83,692
2017: 79,483
2016: 83,030
2024 Goals
- Monitor water fixture ratings to start benchmarking water use.
- Follow WaterSense recommendations for maximum water fixture ratings for future repairs and retrofits.
- Continuously monitor water usage and implement a water leak detection procedure.
Natural gas
As with electricity, natural gas has an emission factor of 1.89 kg/m3 of CO2e. It is used almost exclusively for heating buildings, but a natural gas generator will also be installed in the near future.
Natural gas use (in m3)
2023: 1,213,888
2022: 1,257,000
2021: 1,201,077
2020: 1,136,306
2019: 1,404,277
2018: 1,241,535
2017: 1,178,395
2016: 1,244,191
2023 Goals
- Retrofit heating systems to switch to electricity as the primary source of heating.
- Investigate the procurement of renewable natural gas (RNG).
WASTE DIVERSION
The main contributor to emissions from waste sent to landfills comes from buried organic material that decomposes into methane. Methane is a significant driver of climate change. Therefore, diverting organic material from landfills abates most of the emissions, and it can be reused as compost.
Our last waste audit for all waste generated from the passenger terminal building in 2017 indicated a global diversion rate of 30–35% away from landfills. With the main waste sorting room retrofit, better-sorting posters at the source, more environmental training, and the addition of new waste streams such as e-waste, refrigerants, and scrap metal, we are confident these measures will help us achieve our diversion rate target of 60%.
Future Goals
- Divert all organic waste from landfills.
- Reach an overall waste diversion rate of at least 60%.